Market Data Bank
Click image to enlarge
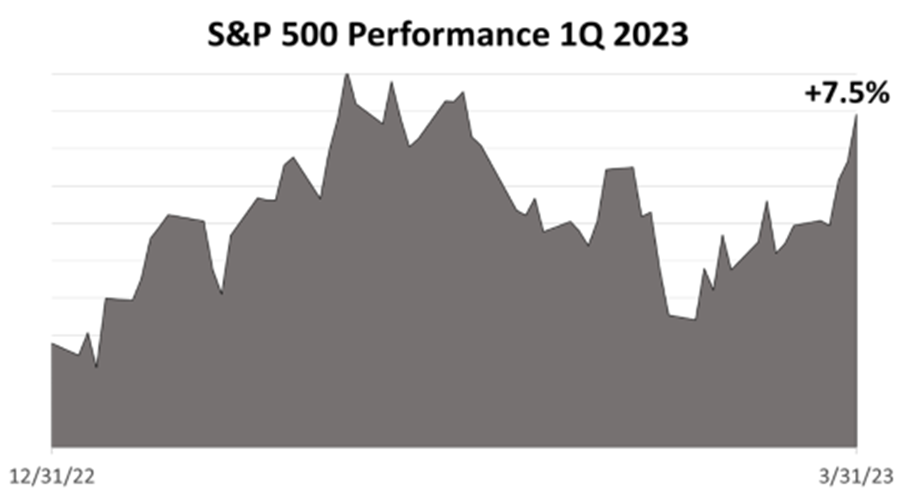
A STRONG QUARTER FOR STOCKS
The Standard & Poor’s 500 stock index appreciated by a strong 7.5% in 1Q 2023. In the final three weeks of the quarter, stocks overcame a sudden threat to the banking system that began with the failure of Silicon Valley Bank, which complicated the Federal Reserve’s 13-month long monetary tightening campaign.
Click image to enlarge
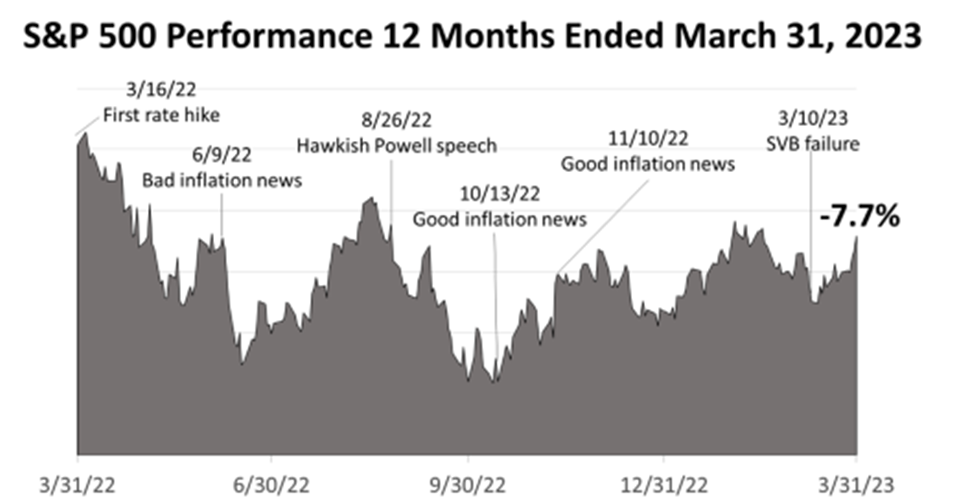
A DIFFICULT 12 MONTHS
High inflation, the pandemic, Russian war on Ukraine, rising loan rates, and fears of recession resulted in a loss of –7.7% through March 31, 2023. After peaking Jan. 3, 2022, stocks had declined by more than -20% on June 13, 2022. As Q2 2023 began, inflation and the bank crisis showed signs of coming under control.
Click image to enlarge
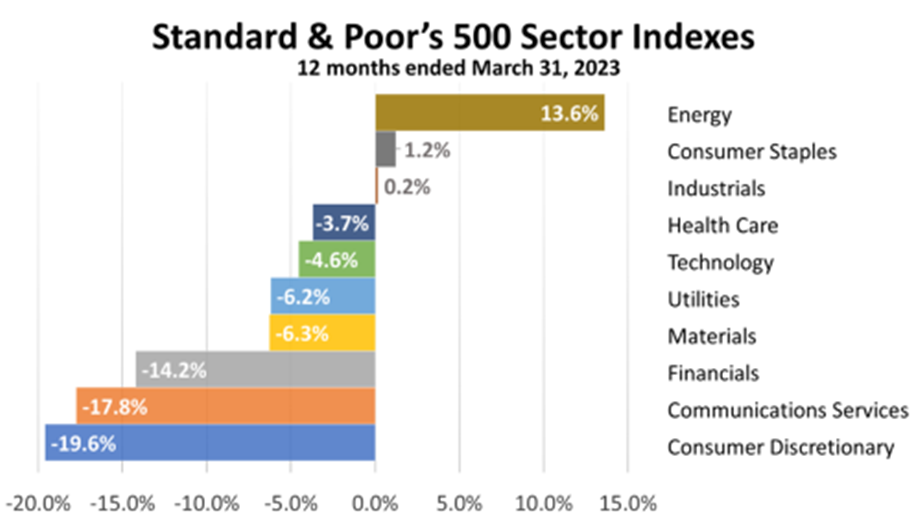
12-MONTH INDUSTRY SECTORS
Higher oil prices related to the Russian invasion of Ukraine propelled energy companies to the top of the 10 industry sectors in the S&P 500 stock index in the 12 months shown. Energy was No. 1 for the past five quarters but it was the worst performer for the five previous quarters starting in 4Q 2019.
Click image to enlarge
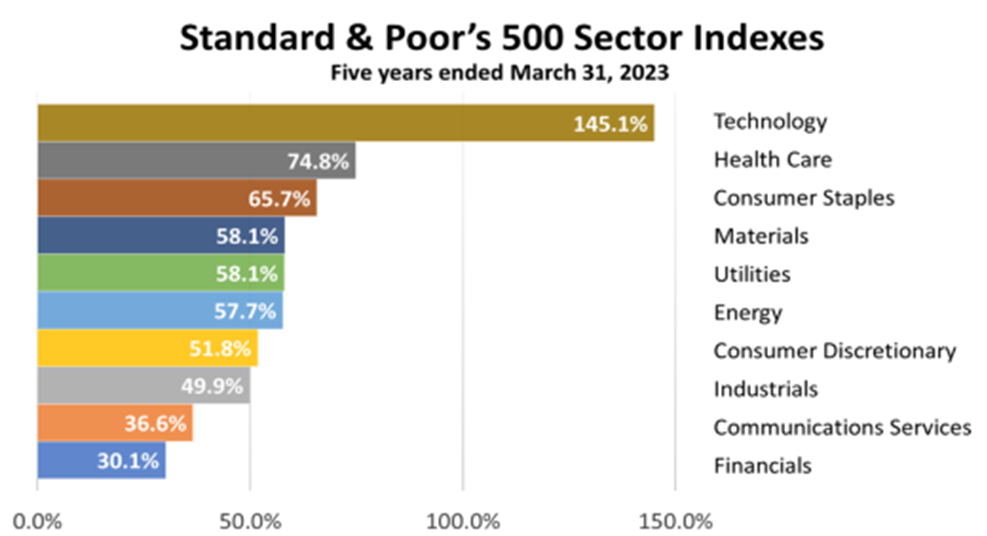
FIVE-YEAR INDUSTRY SECTORS
Technology stocks led the stock market during the pandemic because people stayed home and did everything online. However, became laggards in the past year. Predicting which sectors will be next to soar or plunge is not a possible with consistency, which is why strategic asset allocation and rebalancing is smarter.

Click image to enlarge
U.S. STOCKS BEAT FOREIGN
The U.S. stock market in the five turbulent years shown endured two bear markets, but provided nearly triple the return of European equites and nine times the return on Asian stocks. Chinese stocks, which dominate performance of emerging market stock indexes, lost -16.6% in the five-year period.
Click image to enlarge
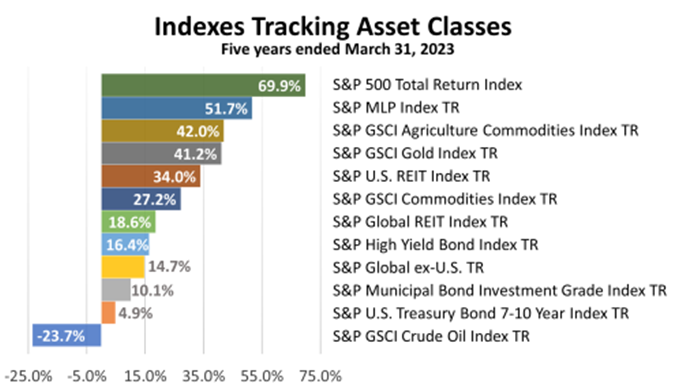
RETURNS ON 13 ASSETS
Despite two bear markets, U.S. stock returns were No. 1 of among a broad array of 13 indexes in the five years ended March 31, 2023. While oil and energy outperformed in the last year, the index of crude oil investments lost -23.7% versus a 69.9.5% return on the S&P 500 index over five years.
Past performance is never a guarantee of your future results. Indices and ETFs representing asset classes are unmanaged and not recommendations. Foreign investing involves currency and political risk and political instability. Bonds offer a fixed rate of return while stocks fluctuate. Investing in emerging markets involves greater risk than investing in more liquid markets with a longer history. Indices are unmanaged and not available for direct investment. Investments with higher return potential carry greater risk of loss. Sources: Sector performance data from Standard and Poor’s. Household net worth data through March 2022 from Federal Reserve Bank of St. Louis, released June 9, 2022; Equity risk premium data from Craig Israelsen, Ph.D, Advisors4Advisors.

At Seneca Financial Advisors, each team member is dedicated to helping our clients plan, simplify, and manage their financial.

Every member of our team is committed to exceptional client service.
You will notice one of the ways we serve you better as soon as you call one of our offices — when a real person.

Choose from single or fully integrated services, with a dedicated advisor.
Through our financial planning process, we customize our services to meet the specific financial needs of each client.

-
This Week’s News For Investors
Here's an analysis of this week's economic news with perspective on how it affects investing
- Read More
