Market Data Bank
Click image to enlarge
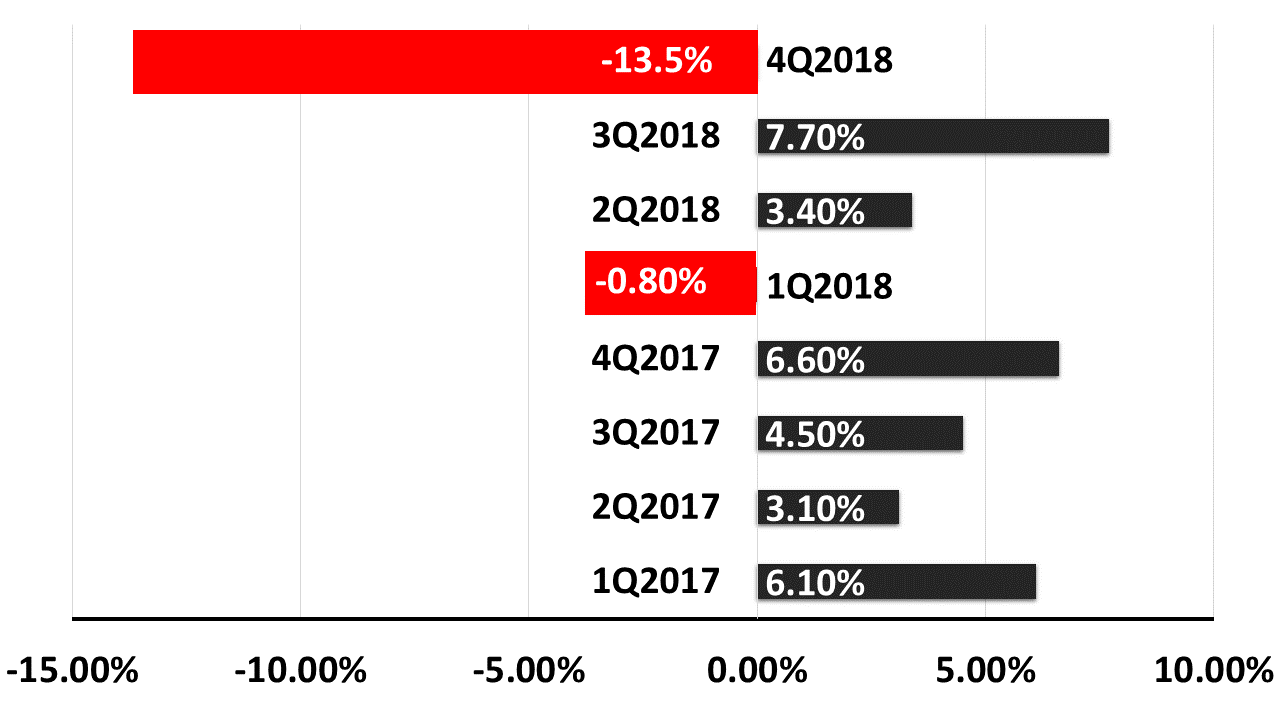
S&P 500 DROPPED SHARPLY IN 4Q18
The Standard & Poor’s 500 stock index posted a -13.5% loss in 4Q 2018, following a huge +7.7% total return in 3Q2018, a +3.4% return in 2Q, and a -0.8% loss in 1Q 2018. It was the worst quarterly performance for stocks since 2011. Riskier small-caps, meanwhile, lost about 20% of their value in the quarter.
Click image to enlarge
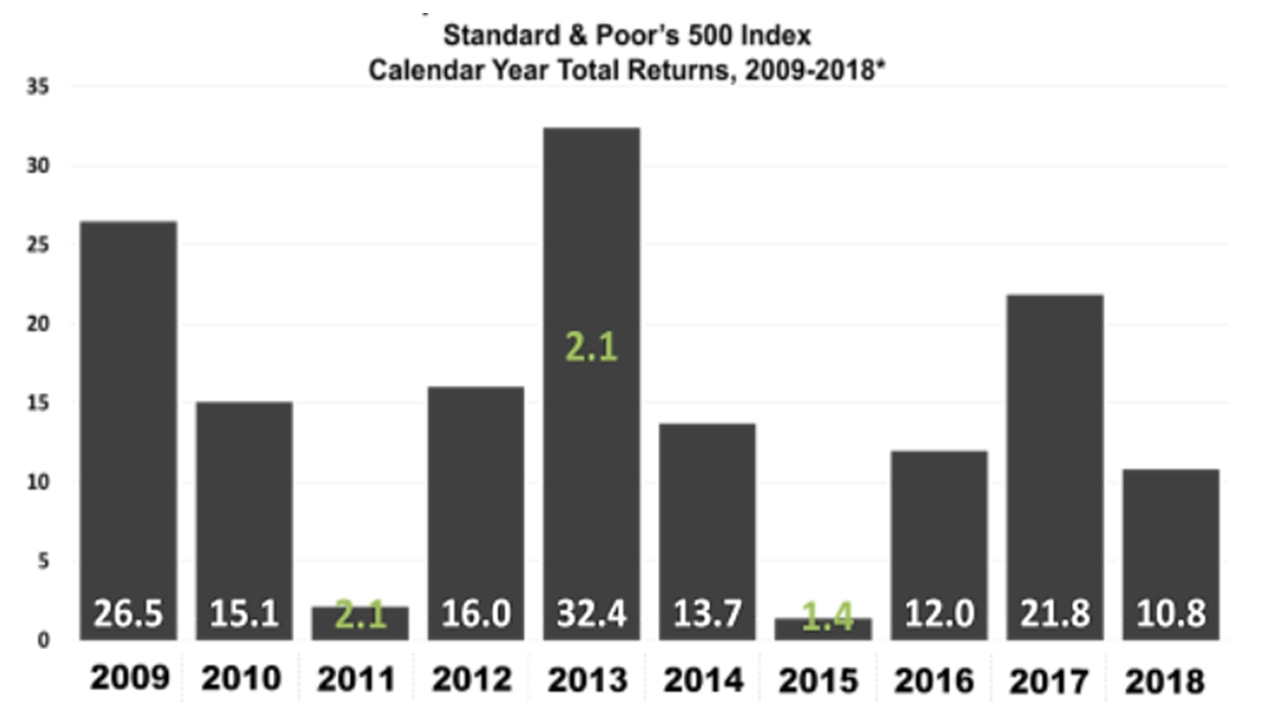
PLUNGE ENDED 9-YEAR 11-MONTH BULL RUN
The plunge followed a spectacular bull run: nine consecutive calendar years of positive returns and a +10.8% return through the first 11 months of 2018. On December 19th, the Fed hiked interest rates a quarter-point, and 2018 ended amid heightened fear the Fed would keep raising rates and cause a recession.

Click image to enlarge
SECTORS SHOW GROWING APPETITE FOR RISK
Though the S&P 500 lost 4.4% in 2018, health care stocks gained 6.5%. The biggest losers were companies related to natural-resources, as slowdown fears caused share values in economically sensitive sectors to suffer the worst damage among industry sectors.
Click image to enlarge
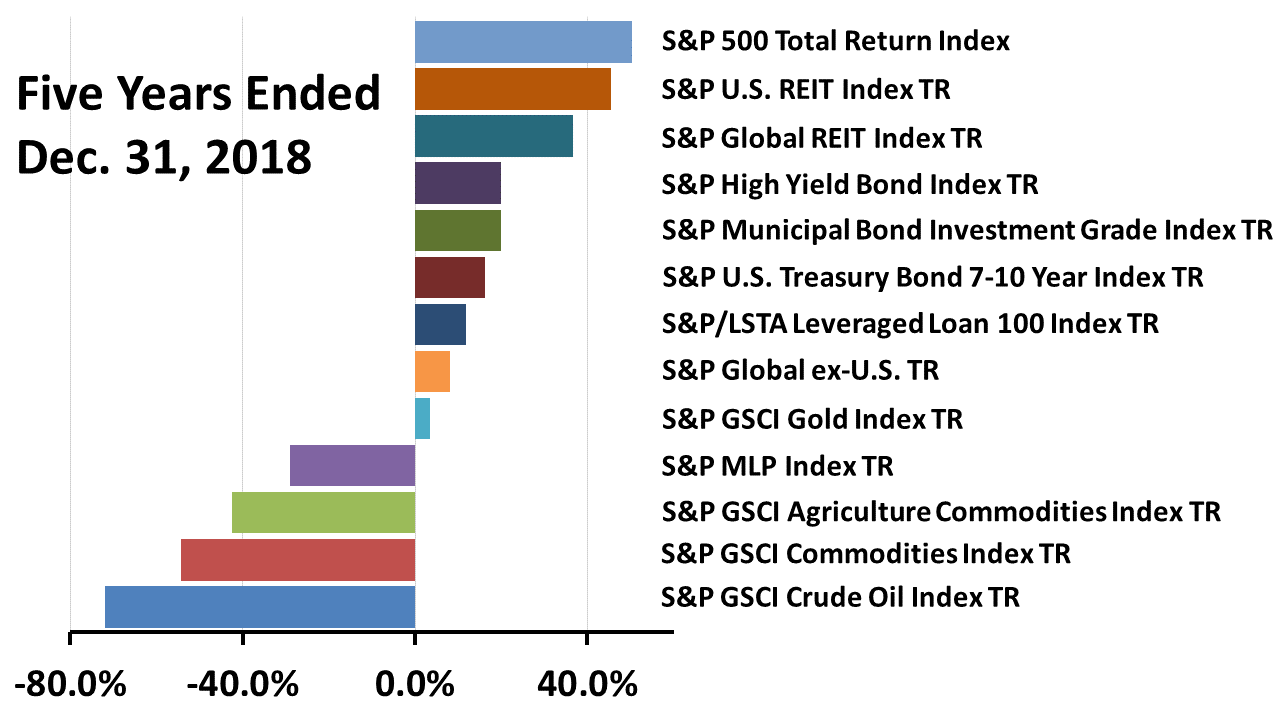
INDEXES TRACKING 13 ASSET CLASSES
Atop this list of 13 asset classes sit U.S. stocks, which outperformed every other asset class in the five years through 2018. The S&P 500 index’s total return of +50% was more than six times the S&P Global ex-U.S. stock market’s return of +8%. U.S. financial economic measures were strong versus other liquid asset classes.

Click image to enlarge
S&P 500 AND POST-WAR EXPANSIONS
At 116-months old, this expansion, following on the 2008 Global Financial Crisis, is highly likely to exceed the longest boom in post-War history, the 120-month long stretch in the 1990s. Unless a black swan event were to occur, strong fundamentals could make this the longest expansion in modern history.
Click image to enlarge
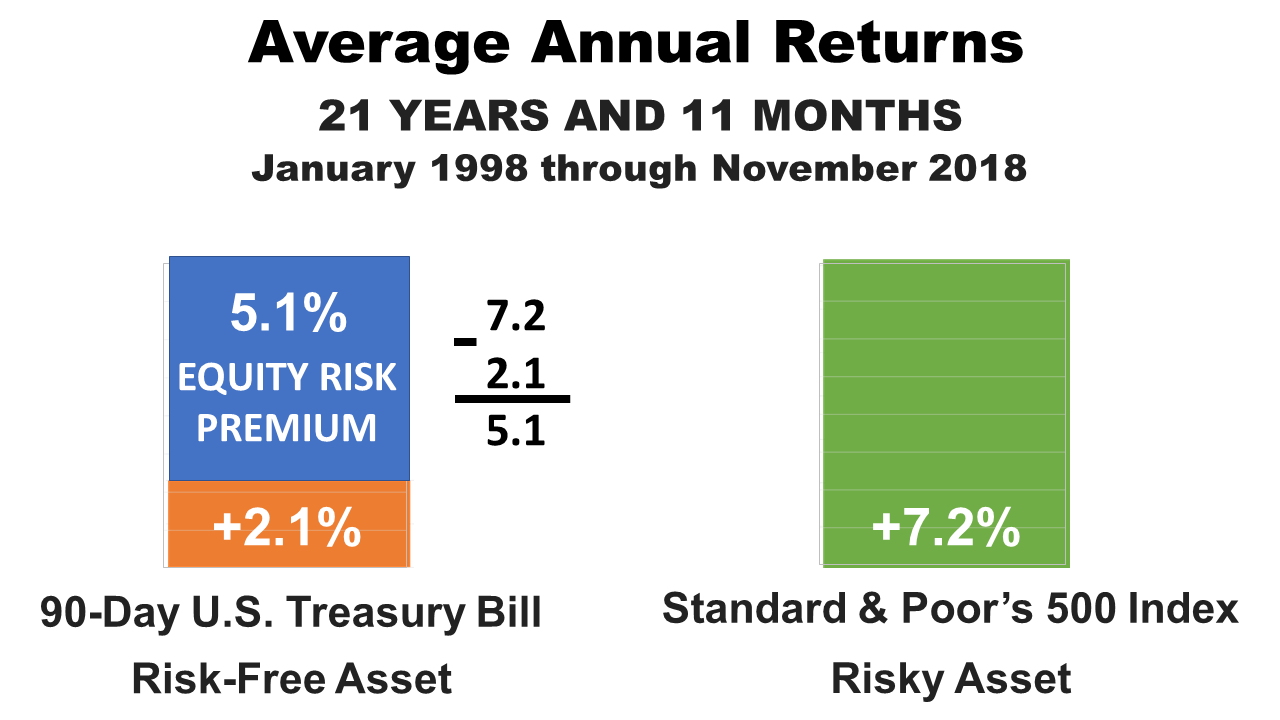
EQUITY RISK PREMIUM
In the 21 years and 11 months through November 30th, 2018, the risk-free 90-day U.S Treasury Bill averaged an annual return of 2.1%, compared to a 7.2% annualized return on the S&P 500 stock index. This period encompassed two financial economic cycles illustrating the current equity risk premium.
Past performance is never a guarantee of your future results. Indices and ETFs representing asset classes are unmanaged and not recommendations. Foreign investing involves currency and political risk and political instability. Bonds offer a fixed rate of return while stocks fluctuate. Investing in emerging markets involves greater risk than investing in more liquid markets with a longer history.

At Seneca Financial Advisors, each team member is dedicated to helping our clients plan, simplify, and manage their financial.

Every member of our team is committed to exceptional client service.
You will notice one of the ways we serve you better as soon as you call one of our offices — when a real person.

Choose from single or fully integrated services, with a dedicated advisor.
Through our financial planning process, we customize our services to meet the specific financial needs of each client.

-
This Week’s News For Investors
Here's an analysis of this week's economic news with perspective on how it affects investing
- Read More
